Startup Observability Adoption Stages
Startup Observability adoption stages provides a structured framework for startups to assess and evolve their observability capabilities. This framework spans three distinct stages, each building upon the previous to create increasingly operational visibility.
Throughout all stages, organizations should maintain a focus on Continuous Review and Cost Optimization as foundational principles.
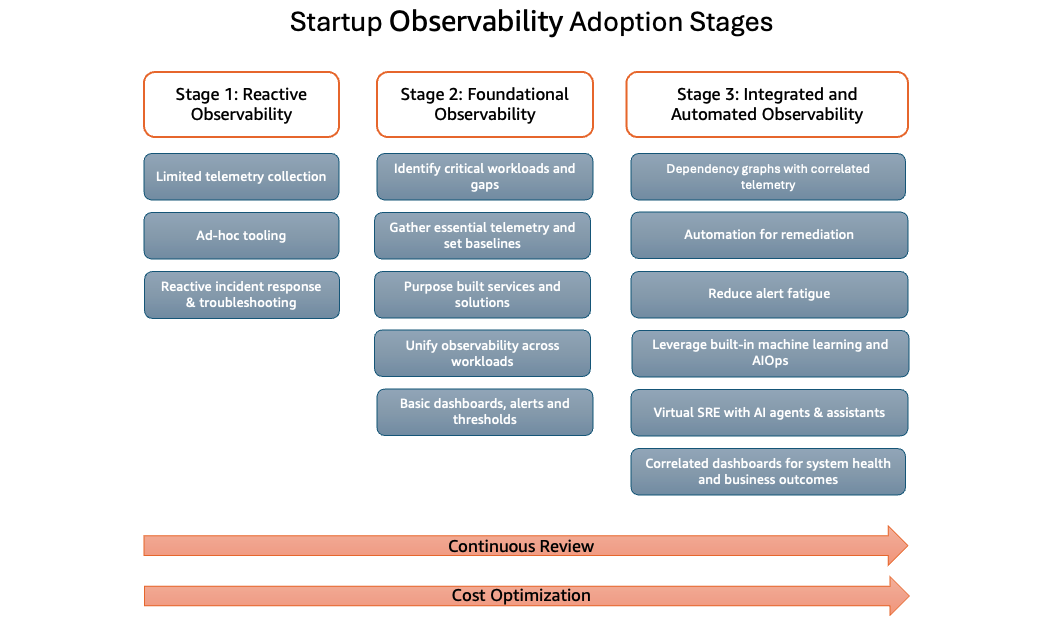
Stage 1: Reactive Observability
This is the starting point for most startups where observability practices are largely reactive in nature. Organizations at this stage typically operate with constrained resources and focus primarily on immediate operational needs.
Key Characteristics:
- Limited telemetry collection: Basic metrics, logs, and traces are gathered, but coverage is incomplete and often inconsistent across systems. Data collection may be occasional or focused only on the most critical components.
- Ad-hoc tooling: Monitoring solutions are implemented on an as-needed basis, often resulting in a fragmented toolset across different teams. Teams may rely on free-tier offerings, open-source solutions without standardization, or built-in cloud provider tools with limited or no integration.
- Reactive incident response & troubleshooting: Issues are typically discovered through customer complaints or system failures rather than proactive detection. Troubleshooting is manual, time-intensive, and dependent on individual team members' knowledge and expertise.
Common Challenges:
- Extended mean time to detect (MTTD) and resolve (MTTR).
- Difficulty reproducing and diagnosing issues.
- Limited historical data for trend analysis.
- Knowledge silos within engineering teams.
Stage 2: Foundational Observability
This stage marks the transition from reactive approach to intentional observability strategy. Startups begin implementing systematic approaches to monitoring and establish the groundwork for scalable observability practices.
Key Characteristics:
-
Identify Critical Workloads and Gaps: Startups should begin by defining critical workloads, such as systems with the highest impact on customer experience, revenue, or core operations, and by analyzing existing observability gaps through collaboration between business and technical stakeholders. Building a systematic checklist or template would be
- Build a systematic checklist that defines critical flows (such as sign-up, checkout, payment processing for an e-commerce startup) and map associated services, data stores, and dependencies.
- Assign engineering and business owners for accountability, then define key technical signals (latency, errors, utilization metrics) for each workload while flagging where metrics, logs, or traces are missing or siloed.
- Map business KPIs such as order completion rate or checkout abandonment to each workload, ensuring complete observability coverage from both technical and business perspectives.
-
Gather Essential Telemetry and Set Baselines: Collecting metrics, logs, and traces provides business and engineering teams a unified view of workload performance, enabling early anomaly detection and faster root cause analysis. Over time, this correlated data builds understanding of normal behavior, making it easier to fine-tune alert thresholds and reduce noise. Startups should start tracking consistent metrics across three core categories:
- Core Service Health including resource utilization (e.g. CPU, memory, DB connections), latency (e.g. p95/p99 response times), traffic (e.g. requests per second), error rates (e.g. 4xx/5xx).
- Reliability and Availability covering uptime and SLOs, incident metrics (e.g. MTTR, alert volume), and customer impact indicators (e.g. failed user actions, support tickets).
- Product and Business Metrics such as revenue rate, transaction success rate, churn and retention, active sessions, and cost per tenant that are tailored to the startup's specific industry and domain.
-
Purpose-Built Services and Solutions: Leveraging managed AWS observability platforms significantly reduces operational overhead and accelerates observability adoption for startups. Amazon CloudWatch for metrics and logs, combined with AWS X-Ray for distributed tracing, delivers deep, real-time visibility with minimal configuration. Purpose-built features like CloudWatch Container Insights, Lambda Insights, and Database Insights enable easy monitoring setup for specific workload types. Fully managed services handle provisioning, scaling, and securing collectors, storage, and visualization tools while providing built-in alerting, dashboards, and analytics—eliminating the need for custom pipelines. Tight integration with core AWS services enables faster insight-to-action loops as workloads evolve. From a cost perspective, pay-as-you-go pricing combined with hidden savings from not managing monitoring infrastructure such as no clusters to provision, scale, secure, or upgrade gives the opportunity for SRE and DevOps teams to focus on product features and customer experience rather than observability infrastructure.
-
Unify Observability Across Workloads: Observability is most effective for startups when implemented as a unified capability across all workloads, rather than being fragmented by team, product, or environment. Siloed tools, inconsistent data schemas, and divergent telemetry protocols make it difficult to trace issues from user-facing symptoms to underlying root causes. This fragmentation increases the mean time to detect and resolve incidents. Standardizing telemetry through shared data models, consistent naming conventions, and standard frameworks such as OpenTelemetry allows metrics, logs, and traces to be correlated reliably across services and environments. Adopting an extensible observability platform such as Amazon CloudWatch provides a single source of truth, reduces multiple tooling complexity, and supports faster, more reliable incident detection and resolution as the business scales.
-
Basic Dashboards, Alerts, and Thresholds: Basic dashboards, alerts, and threshold definitions form the first structured layer of operational visibility for startups. Amazon CloudWatch provides essential capabilities out of the box such as metrics for core AWS services, alarms that evaluate metrics against defined thresholds, and dashboards that visualize system health across regions and accounts. This foundation enables teams to shift from discovering issues through customer complaints to detecting them through infrastructure and application signals. A shared CloudWatch Dashboard showing key metrics, alarm states, and trends gives engineers, product managers, and leaders a common understanding of system health, while CloudWatch Alarms integrated with Amazon SNS or incident tooling provide immediate notifications during threshold breaches. CloudWatch recommended alarms help teams identify best-practice metrics and thresholds for managed services. By investing early in these primitives, startups create a consistent operational interface that scales from a handful of services to complex architectures without requiring complex refactoring of monitoring foundations.
Common Outcomes:
- Reduced incident response times.
- Improved cross-team collaboration and knowledge sharing.
- Standardized operational procedures.
- Foundation for data-driven decision making.
Stage 3: Integrated and Automated Observability
Integrated and automated observability represents mature observability practices where startups leverage sophisticated tooling, automation, and machine learning to achieve operational excellence. Observability becomes deeply integrated into both technical operations and business strategy.
Key Characteristics:
-
Dependency graphs with correlated telemetry: Leverage AWS observability services such as Amazon CloudWatch Application Signals, Application Maps, and AWS X-Ray trace maps to automatically discover and visualize services, downstream dependencies, and cross-account interactions. This dependency graph serves as a lightweight knowledge graph connecting services, data stores, external APIs, and infrastructure components. By combining SLOs and critical paths onto this foundation, teams gain the ability to quickly assess blast radius, understand potential impact during changes, deployments, or incidents, and take proactive action to mitigate risk before issues reach customers.
-
Automation for remediation: Analyze recurring alerts using AWS observability services and implement automated remediation workflows to reduce operational overhead and ensure consistent incident response. Orchestrate AWS services including Amazon EventBridge, AWS Lambda, and AWS Systems Manager to trigger and execute automated remediation actions based on defined alert conditions. Surface high-signal alerts through Amazon CloudWatch dashboards and integrated notification channels such as Amazon SNS and chat platforms, enabling teams to iteratively refine runbooks, improve signal-to-noise ratios, and minimize manual intervention in routine incident handling.
-
Reduce alert fatigue: Design alerting strategies around well-defined business and reliability objectives rather than low-level signals. Map alerts to critical services, SLOs, and customer-impacting behaviors, tuning thresholds to trigger only for sustained or significant deviations. Group and correlate related conditions into higher-level alarms, apply dynamic or anomaly-based thresholds where appropriate, and suppress alerts during known maintenance windows to keep notifications focused on real incidents. Establish governance by defining severity tiers, ownership, and response expectations for each alert class, ensuring operational attention is reserved for events that materially affect availability, performance, or cost.
-
Leverage built-in machine learning and AIOps: Startups should utilize built-in machine learning capabilities within AWS observability services to transform raw telemetry into actionable insights with minimal setup. AIOps capabilities enable lean teams to detect issues earlier, troubleshoot faster, and focus engineering resources on product development rather than maintaining custom detection pipelines or manually crafting complex alert rules. AWS observability services offer many in-built machine learning capabilities.
- CloudWatch Anomaly Detection automatically learns normal baselines, accounts for seasonality, and surfaces anomalous behavior without static thresholds, enabling earlier detection of performance regressions and reliability issues.
- CloudWatch Outlier Detection continuously analyze metrics of systems and applications, determine normal baselines, and surface anomalies with minimal user intervention.
- CloudWatch Log Anomaly Detection automatically recognizes and clusters patterns in logs, identifying anomalies such as new, unexpected, or frequent errors. It can detect token variations, new log patterns, and frequency changes, which assists in diagnosing issues faster.
- CloudWatch Log Insights uses natural language to generate, update, or summarize CloudWatch Logs Insights queries, allowing you to ask questions without needing to know specific query syntax.
- X-Ray Insights automatically detects anomalies in application performance, identifies root causes of issues across distributed services, and highlights fault patterns and response time degradations without manual trace analysis.
- CloudWatch Investigations provides generative AI-driven assistant that can help you respond to incidents in your system. It uses generative AI to scan your system's telemetry and quickly surface telemetry data and suggestions that might be related to your issue.
- DevOps Guru applies machine learning to detect anomalous behavior and generate prioritized operational insights with recommended remediation actions.
-
Virtual SRE with AI agents & assistants: CloudWatch Application Signals MCP Server lets AI agents act as an virtual SRE for your AWS services by querying Application Signals on your behalf. It exposes tools to audit service health, track SLO compliance, analyze operation-level performance, and investigate issues using traces, metrics, logs, and change events—all via natural language. This gives startup teams faster root-cause analysis, better SLO monitoring, and rich observability workflows directly from the IDE or AI assistant without hand-writing CloudWatch or X-Ray queries.
-
Correlated dashboards for system health and business outcomes: Correlated dashboards that tie system health to business outcomes transform observability from an operational tool into a strategic capability. They present telemetry through two lenses—technical signals and customer or revenue impact—so latency spikes or errors are immediately visible as degraded user journeys or reduced transaction completion. For lean teams, these dashboards bridge infrastructure-centric monitoring and product-centric decisions by bringing metrics, logs, traces, and real-user data onto a single pane of glass. SREs, product managers, and leadership work from the same truth during incidents and reviews, reducing friction and accelerating learning. As startups grow, this correlated view becomes the foundation for anomaly detection, AI-assisted diagnosis, and automated remediation—enabling teams to shift to supervising an autonomous, impact-aware observability system.
Common Outcomes:
- Significant reduction in manual operational overhead.
- Proactive issue prevention and prediction.
- Clear visibility into business impact of technical decisions.
- Optimized resource allocation and cost efficiency with AI/ML powered features.
- Enhanced customer experience through improved reliability.
Cross-Cutting Considerations
Continuous Review
Startups at all adoption stages should regularly assess their observability practices, tooling effectiveness, and alignment with evolving business needs. This iterative approach ensures that observability capabilities grow alongside the organization.
Cost Optimization
Observability investments should be balanced against their value delivery. This includes right-sizing data retention, optimizing telemetry collection, leveraging appropriate pricing tiers, and eliminating redundant tooling to maintain cost efficiency throughout the maturity journey.
Progression Considerations
Startups should treat observability as an iterative capability, avoiding large upfront investments in high-cost tooling before telemetry and analysis requirements are well characterized. As system complexity and traffic patterns evolve, teams can periodically reassess their observability posture, adjust sampling and retention policies, and incrementally evolve the tooling stack to maintain an appropriate balance between visibility, performance overhead, and cost.
Advancement through these stages is not strictly linear, and organizations may exhibit characteristics of multiple stages simultaneously across different systems or teams. The appropriate pace of progression depends on factors including:
- Startup growth rate and scaling requirements.
- Available engineering resources and expertise.
- Budget constraints and investment priorities.
- Regulatory and compliance obligations.
Organizations should assess their current state, prioritize improvements based on business impact, and invest incrementally to advance their observability adoption in alignment with their operational needs and strategic objectives.